


What is VES, ERT, IP and SP Electrical Resistivity ?
What is electrical resistivity?
Electrical resistivity sends an electrical current into the ground and maps the resistance against that flow of the current. The resistance can be converted to resistivity, a property used to predict the composition, structure or strength of the underlying materials.
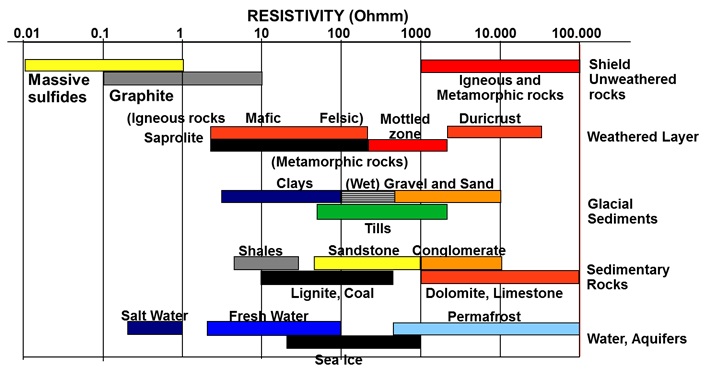
As we all know, different geological materials present different resistivities, the presence of water or mineral ores typically lowers the resistivity of a material, and pollutants will also impact the recorded values. Typically, stronger and harder deposits will have a higher resistivity associated with them compared to rock with structural weaknesses.
What are the common applications for electrical resistivity?
The applications for electrical resistivity are including but are not limited to Bedrock depth detection, bedrock topography, fracture and fault identification, cavity detection and mapping, ores and mineral deposits, geology, soil type or bedrock type/bedrock change, groundwater aquifers, groundwater contamination, saltwater intrusion, waste and pollutant mapping, etc.
Resistivity is an excellent technique to use as a monitoring tool to record changes in ground conditions. Typically applications include groundwater monitoring around landfill areas, to see the spreading of leachate or monitoring of water seepage through earth dams. Measurements can be made by returning to the same place several times to repeat measurements, or equipment can be left on site as part of an automated monitoring project.
Electrical resistivity can be an efficient option to map the subsurface conditions when you need a non-destructive investigation technique or want improved data coverage compared to traditional, point-by-point, intrusive methods(such as drilling or digging). Measurements can be straightforward soundings(just measuring resistivity against depth), 2D profiles or even 3D volumes. Data can be collected on land, in water, or within boreholes and can be single measurements or repeated readings to fulfill a need for monitoring of changes in survey.
What’s the main method of electrical resistivity?
Depending upon the position of the current and potential electrodes, data will be collected at different depths (z co-ordinates) and beneath different surface positions(X and Y coordinates) as individual points. These can then be combined to create a 1D sounding or profile, a 2D profile or 3D volume.
1D SOUNDING(VES) & PROFILING
A Vertical Electrical Sounding(VES) measurement is where data are collected from different depths beneath a fixed point at the surface. This means that all data points will have the same surface position(X and Y coordinates) but will be measured at different depths(Z coordinate).
Electrode placement is based around a midpoint. The further way from the midpoints electrodes are placed, the deeper the measurement will be. For each data point electrodes needs to be moved manually. Data are usually presented in a graph with depth on one axis and apparent resistivity on the other. These raw data are then put forward for inversion.
Resistivity investigation can also be carried out at a constant depth but under different surface positions, usually referred to as Profiling. These data is not normally put through inversion, and a plot of resistance or apparent resistivity against profile distance is the final output.
2D AND 3D MEASUREMENTS (ERT)
By combining measurements at both different depth and lateral positions an ERT(Electrical Resistivity Tomography) survey, also sometimes known as Imaging, is completed. Because ERT is a multi-dimensional method, data points can be measured in a 2D profile or a 3D grid.
For a 2D profile, multiple electrodes are placed in a line at a set distance. The system automatically selects which electrodes to use for current injection and voltage readings and, in a short time, can measure a high number of data points. Data points will have varying X and Z coordinates, but a fixed Y coordinate.
For a large-scale 3D survey, the data from a number of (ideally parallel) 2D survey lines can be combined in the processing software to model resistivity variations in X, Y and Z simultaneously. This process of forming a 3D dataset is specifically referred to a 2.5D survey.
For smaller survey areas, electrodes can be laid out in a grid and the 3D dataset is formed directly on the instrument; this is a “true” 3D survey.

IP (INDUCED POLARISATION)
IP(Induced Polarisation) is an active model(i.e one which requires a current injecting) where we record how the voltages in the ground react when the current is applied and removed; this reaction is referred to as the changeability of a material. Chargeability data can be collected during the same measurement cycle as the resistivity data and having this additional dataset can help us in our interpretation of materials. For example, mineral ores and clay deposits have a high chargeability associated with them.
These electrical methods are not limited to surface land measurements, they can also be applied within bodies of water, to investigate sediments and the underlying geology, and also within boreholes, allowing improved resolution at depth.
SP (SPONTANEOUS OR SELF POTENTIAL)
SP(Spontaneous or Self Potential) is a means of recording the natural voltages in the ground without injecting any current from the instrument. This is most commonly used as a means of identifying large sulfide ore bodies but also has applications in identifying water seepage and identifying pollution plumes.
Further information for electrical resistivity
As resistivity is a “ galvanic” method, it requires a physical electrical connection to the ground. This normally means that the steel electrodes have to be pushed into the material under investigation, although it is possible to use plate plate electrodes on some hard surfaces. Two electrodes are used to inject current(“current electrodes”), and a minimum of two electrodes are used for voltage readings(“potential electrodes”). Knowing the injected current and the measured voltage, the resistance of the ground can be calculated.
The resistance value is then recalculated to apparent resistivity. The apparent resistivity is a result of current flowing through all the ground beneath the electrodes rather than just information from a discrete point or layer. These values, on their own, will not be suitable for making an interpretation and thus a further processing step, called inversion, is required. In this process, software is used to find a model of resistivity distribution that would produce the same result as the data recorded in the field. The resistivity values within the returned model will form the basis for an interpretation.
In hydrogeophysical investigation such as groundwater mapping, clay(flow resistivity) can be distinguished from sand(high resistivity), or salt water(low resistivity) from fresh water(high resistivity), or wet sand(lower resistivity) from dry sand(high resistivity).
However, the resistivity to material translation is non-unique and the resistivity span of the various geological components overlap, thus a certain level of ambiguity may have to be dealt with.
Also, completely different geological layer in completely different geological scenarios can have the same resistivity, hence some prior knowledge of the geological setting from local knowledge, geological maps and/or boreholes must always contribute to a geological interpretation of a geophysical survey.

ARE THERE ANY LIMITATIONS OR NOTES IN APPLYING ELECTIRCAL RESISTIVITY SURVEY?
Resistivity measurements work for a huge range of different ground conditions, but the method has some limitations.
Over bare rock or very hard/dry/frozen surface, it may not be possible to hammer in electrodes and they would need to be drilled in which is a laborious process. Custom-made plate electrodes can sometimes be an option.
If the investigation depth is more than 500meters another geophysical investigation technique should be considered.
The length of the cables used can be extensive; the ratio of depth to cable length is approximately 1-to-5 so, for a maximum depth of 100m, the system will requires a 500m cable spread.
High resolution results need a very dense electrodes set-up, which increases the field time. A rule of thumb is that the theoretical lateral resolution of an ERT survey is approximately half the electrode spacing.
WHAT DOES SEIS TECH SUPPLY FOR ELECTRICAL RESISTIVITY SURVEY?
As an ISO 9001:2015 certified manufacturer, Seis Tech supplys series of ert cables and other related resistivity items professionally:
ERT Cables (Land, Shallow Water, Marine or Borehole Survey Optional) for assorted resistivity systems.
IP Resistivity Cables(Land, Shallow Water, Marine or Borehole Survey Optional) for assorted resistivity systems.
Unipolar Cables of AB Wires and MN Wires for VES.
Cable to Electrode Jumpers / Cable Jumpers for assorted resistivity systems.
Non Polarizing ERT Electrodes.


