


What to Look for in a Research-Grade Geophone
If you’re asking what features you should look for in a geophone for geophysical research, the answer lives in five or six specifications that most buyers either overlook or misread entirely. Geophone spec sheets have a way of looking nearly identical until you’re in the field with the wrong sensor and a data sheet you can’t use. The numbers are there: natural frequency, sensitivity, damping ratio.
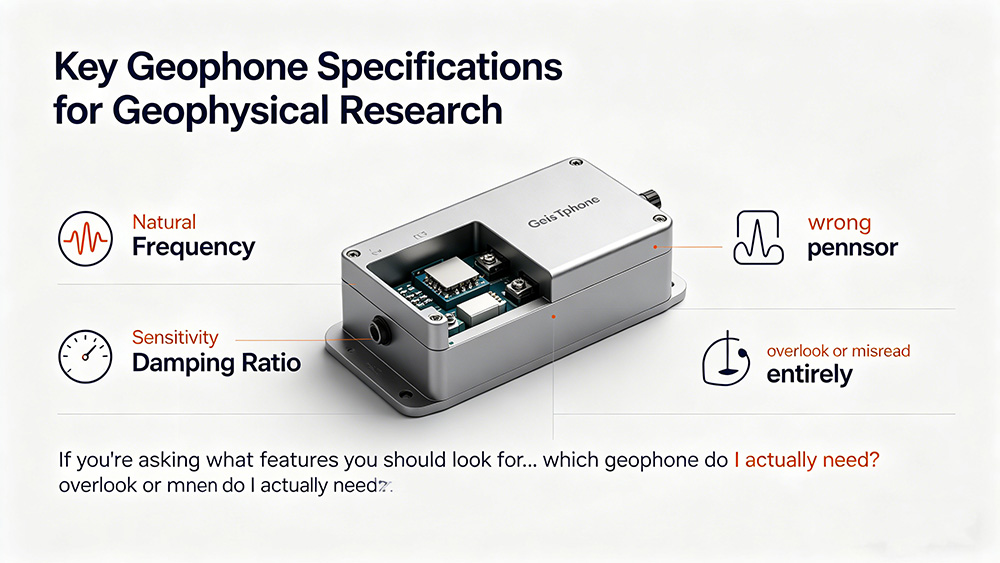
Without context, they don’t tell you whether the sensor you ordered will actually capture the signal target you’re after at the depth you’re investigating. At Seis Tech Inc., this question comes in regularly from university labs, USGS- affiliate researchers, and geotechnical teams: “which geophone do I actually need?”
A wrong choice doesn’t just mean slightly noisier data. It means re-surveys, compromised publications, or wasted field days trying to extract signal from a sensor that was never designed for your application. This guide walks through each of those specifications, explains what the numbers mean in practice, and helps you match the right sensor to your survey objectives before you commit to a purchase.
Natural frequency: the spec that governs investigation depth
Natural frequency, sometimes called corner frequency, is the single most consequential specification on any geophone data sheet. It defines the lowest frequency the sensor can record reliably and, by extension, one of the primary factors governing the maximum depth your survey can image, alongside source energy, receiver spread, and array geometry. A sensor responds above its natural frequency; below that point, output rolls off at 12 dB per octave. Trying to recover signal below the corner frequency with electronic gain amplifies noise proportionally, making reliable signal reconstruction below that become difficulty.
Most research applications fall into three frequency bands. Low frequency sensors at 2Hz are the choice for deep crustal studies, basin characterization, and ambient noise tomography where investigation depths extend well beyond 30 meters. The 4.5Hz sensor is the workhorse of near surface geophysics: the standard configuration for MASW surveys targeting shear wave velocity profiles to approximately 30 meters depth, and the go to for most seismic refraction work.
Higher frequency sensors in the 10Hz to 28Hz range serve shallow geotechnical targets and borehole VSP applications where P wave resolution at close range is the priority. These depth ranges are practical guidance; actual investigation depth also depends on source energy and array design.
For MASW specially, the Kansas Geological Survey and multiple MASW survey recommendations consistently recommend 4.5Hz geophones as the standard configuration, with 2Hz sensors used when investigation depth needs to push beyond 30 meters. Borehole and down-hole VSP work typically calls for 10Hz to 28Hz sensors. Selecting outside these bands does not give you more data; it gives you attenuated or missing signal in the frequency range your processing depends on.
| Frequency | Typical Applications | Typical Survey Depth |
| 2Hz | Deep crustal studies, basin characterization, ambient noise tomography | Greater than 30 m |
| 4.5Hz | Surface MASW (multichannel analysis of surface waves)and shallow refraction | Approximately 30 m |
| 10 to 28Hz | Shallow geotechnical surveys and borehole VSP | Less than 15m |
Sensitivity and damping ratio: how well the sensor hears the ground
Understanding sensitivity thresholds for research work
Sensitivity expresses how much voltage the geophone produces per unit of ground velocity, measured in V/(m/s). A higher value means more signal output before your recording system needs to apply gain, which directly improves signal-to-noise ratio in low-energy environments. Based on published manufacturer specifications and product comparisons across the industry, research-grade sensors typically fall between 80 and 200 V/(m/s), while sensors below 30 V/(m/s) force more electronic amplification and, with it, more amplified noise.
Practical sensitivity ranges in the field
The practical threshold matters here. Below 30 V/(m/s), the sensor is functional for strong-source surveys but marginal for passive seismic or ambient noise work. The 80 to 100 V/(m/s) range covers the majority of land seismic research applications solidly. Sensors above 150 V/(m/s) are preferred for low-amplitude passive seismic and micro seismic monitoring, where signal energy arriving at the sensor is small to begin with.
Damping ratio: response behavior near natural frequency
Damping ratio control show the sensor behaves near its natural frequency. The standard target for research-grade velocity geophones is 0.7 to 0.8, a range recommended in USGS calibration practice and CREWEStechnicalliterature. At this range, the amplitude response is fat across the usable bandwidth with minimal resonance. Under-damped sensors (below 0.6) produce a sharp resonance peak near the natural frequency that over-amplifies signals in that narrow band, introducing artifacts that distort quantitative analysis. Over-damped sensors suppress signal at and above the corner frequency, blurring timing information and degrading S-wave velocity estimates. Factory-calibrated sensors tuned to 0.707 ± 0.05 represent the research standard.
Coil resistance and impedance matching
One detail that catches buyers off guard: coil resistance affects impedance matching with your recording system. Common coil resistance values range from roughly 395 ohms to over 1,800 ohms depending on the model, a range reflected across widely used sensors in published data sheets. If the geophone’s output impedance doesn’t match your seismograph’s input impedance, effective sensitivity drops. Always verify impedance compatibility between your sensor and recorder before purchase, not after.
Noise floor and dynamic range: where research-grade performance separates from the rest
Passive vs. active survey dynamic range needs
Self-noise is the sensor’s internal electrical noise floor, expressed in velocity-equivalent units. Dynamic range is the ratio between the largest and smallest signals the system can record simultaneously. Both determine whether your geophone captures low-amplitude arrivals in realistic field conditions, and both are routinely underspecifed by researchers who focus only on sensitivity numbers.
Below the natural frequency, sensitivity decreases at 12 dB per octave while thermal noise stays constant, which means the signal-to-noise ratio degrades steeply as you push below the corner frequency. High-quality moving-coil geophones have self-noise floors that approach those of broadband seismometers above 1 Hz, a comparison supported by published noise spectra from instrument characterization studies and broader seismicnoisestudiesinurbanenvironments. Below 1 Hz, MEMS accelerometer outperform traditional geophones and are worth considering for very low-frequency research applications such as sub-Hz ambient noise monitoring.
Dynamic range requirements vary by survey type. Active source surveys using sledgehammer or vibroseis sources typically need 100 to 110 dB, consistent with standard recorder and ADC design guidelines for land seismic acquisition. Passive seismic and microseismic monitoring applications call for 120 dB or more to capture both the background noise floor and transient arrivals without clipping. The ADC resolution and gain staging on your recorder interact directly with these requirements: a geophone with excellent intrinsic dynamic range paired with a low-resolution digitizer still produces a compromised dataset.
| Survey Type | Typical Source | Required Dynamic Range | Notes |
| Active | Sledgehammer, Vibroseis | 100,110 dB | Standard recorder and ADC guidelines |
| Passive | Ambient noise, Microseismic events | ≥120dB | Captures background noise floor and translents |
Single-component vs. 3C sensors: matching geometry to your research objective
Most geophysical research executes effectively with a vertical single-component geophone. Rayleigh waves, compressional arrivals, and standard refraction surveys produce dominant vertical ground motion. Single-component arrays deploy faster and cost less, generating datasets that also process faster. These are practical advantages that matter on large academic surveys with limited field crews and tight schedules.
Three-component sensors become necessary when your research question requires full particle motion information. HVSR (horizontal-to-vertical spectral ratio) analysis requires simultaneous horizontal and vertical recordings by definition. Earthquake source characterization, P/S wave polarization analysis, and borehole VSP work with mode separation all justify the added complexity and cost. Landslide and slope stability monitoring programs where wave polarization direction is itself a key output also fall in this category.
A hybrid array approach, using 3C sensors at select stations and single-component sensors everywhere else, is increasingly common in research programs. This balances data completeness with cost and deployment time. Processing time and data volume scale significantly with 3C deployments; budget your computing resources accordingly when designing the array.
Ground coupling and environmental specs: the variables that field researchers underestimate
A precisely specified geophone produces degraded data if it’s poorly planted. Ground coupling is not a secondary concern; it’s a measurable variable that directly alters the sensor’s effective frequency response in the field. Coupling resonance between the geophone base, spike, and soil introduces distortion that typically peaks between 30 and 200Hz depending on terrain conditions.
Field studies confirm that mounting method measurably shifts the recorded signal. Firmly spiked geophones with full base-to-soil contact produce coupling resonance above 130Hz, which sits well outside most research survey bandwidths. A gap of just 1 centimeter between the base and soil drops that resonance below 30Hz, distorting the usable signal window. In soft or swampy terrain, coupling effects become severe enough to require buried sensors or plate mounting to maintain acceptable data quality. For more detail on this effect see the classic geophonegroundcouplingstudy.
Environmental specifications that matter for field research include IP rating, tilt tolerance, and operating temperature range. For field-deployable research sensors operating in rain, mud, or shallow water, IP67 or better is the practical minimum, a threshold reflected in vendor data sheets for scientific-grade geophones. Tilt tolerance varies by model; many sensors maintain specification within ±5 to 10 degrees of vertical, which becomes critical on sloped terrain or during borehole deployment. Operating temperature range is non-negotiable for high-altitude, arctic, or desert research programs where ambient conditions push well outside standard ranges.
What to look for in a geophone supplier before you commit
Choosing the right sensor specification is half the decision. The supplier behind it determines whether those specifications are actually met, batch after batch, across multi-year research programs.
For academic institutions and government labs, procurement processes often require documented quality credentials and compliance verification before purchase orders are approved.
ISO 9001:2015 certification means the manufacturer operates a documented quality management system with traceability across production and testing. Under Clause 7.1.5 of this standard, measurement equipment used in factory testing must be calibrated against traceable international standards, calibration records must be maintained, and nonconforming equipment must be controlled. For the buyer, this translates into factory acceptance test data that you can actually request: sensitivity, natural frequency, and damping ratio confirmed against data sheet values for each production batch, not just marketing specifications. Without this documentation, you’re taking the spec sheet on faith.
At Seis Tech Inc, our velocity geophones are purpose-built for research-grade land applications across 1Hz, 2Hz, 4.5Hz, 5Hz, 10Hz, 14Hz,28Hz,40Hz,60Hz and 100Hz configurations, with ISO 9001:2015 certified manufacturing and Part of the above mentioned geohpone sensors are manufactured by RoHS 2.0 compliant materials. All the geophones supplied by Seis Tech will be delivered to clients with calibration certificate. This combination satisfies the documentation requirements most university procurement.
Office and government labs require: vertified performance documentation and environmental compliance in a single supplier relationship.
Putting it all together before you request a quote
When asking what features you should look for in a geophone for geophysical research, six specification ultimately determine fitness for purpose: natural frequency, sensitivity and damping ratio, noise floor and dynamic range, sensor geometry, ground coupling and environmental specs, and supplier credentials.
None of these works in isolation. A sensor with excellent sensitivity but mismatched impedance loses that advantage at the recorder. A well-damped sensor planted in soft terrain without proper coupling discipline produces a distorted frequency response regardless of what the data sheet says.
The right geophone for your research is the one that matches both the survey physics and the field conditions, not the one with the most impressive headline specification. Before requesting quotes, map your survey depth target to the appropriate corner frequency band, confirm your sensitivity and dynamic range requirements against your signal source and passive noise environment, and verify that your supplier can provide the quality documentation your procurement process requires.
References
Kansas Geological Survey. (2010). MASW Survey Recommendations and Best Practices. Retrievedfrom https://www.kgs.ku.edu/MASW/MASW-SSC-Vs30mACQ.html
USGS. (2022). Seismic Instrumentation Calibration and Standards. U.S. Geological Survey Open-FileReport2022, 100. https://doi.org/10.3133/ofr2022100
Crewes Research Reports. (2006). CREWES Technical Literature on Geophone Damping. University of Calgary. https://crewes.org/Documents/ResearchReports/2006/2006-03.pdf
Campbell Scientifc. (2018). Geophone Ground Coupling Techniques. Retrieved from https://www.campbellsci.com/geophone-installation


