




How High Sensitivity Geophones Turn Traffic Noise into Subsurface Maps
In recent years, the geophysical community has witnessed a massive paradigm shift in near surface exploration. Urban environments present severe logistical challenges for traditional active source seismic surveys. The dense infrastructure and stringent regulations make explosive sources or heavy vibrator trucks completely unfeasible.
To overcome these limitations, researchers have increasingly turned to Ambient Noise Seismic Interferometry. By utilizing dense arrays of high sensitivity geophones, scientists can harvest anthropogenic vibrations, primarily traffic noise, and extract coherent surface waves to generate highly accurate three dimensional shear wave velocity models of the shallow subsurface.
Understanding the Basics of Seismic Interferometry
Traditional geological exploration usually requires setting off explosives or dropping massive steel weights to generate a strong seismic shockwave. While these active source methods are perfectly fine for remote deserts, they are completely impossible to use in heavily populated city centers. You simply cannot detonate explosives next to a residential apartment building or a busy highway.
This is exactly where ambient noise interferometry provides a brilliant solution. Instead of creating a massive artificial shockwave, this passive technique listens to the tiny background vibrations that already exist in the environment. In urban areas, the absolute dominant source of this background energy is vehicular traffic. By recording this continuous rumble, geophysicists can mathematically extract the hidden seismic surface waves and calculate exactly how fast they travel through different layers of soil and bedrock.
The Physics of Ambient Noise Interferometry
The fundamental principle driving this methodology relies on the extraction of the Empirical Green Function from a completely chaotic and diffuse wavefield. In a bustling urban center, vehicular traffic and heavy transit systems act as continuous, randomly distributed surface sources. These sources primarily generate high frequency Rayleigh waves and Love waves.
When two geophones record this ambient noise simultaneously for an extended period, the wavefield traversing between them can be mathematically reconstructed. This is achieved through the cross correlation of the continuous noise records. For two seismic stations denoted as A and B, the cross correlation function CAB(τ) over a recording duration τ is expressed as:
CAB(τ)=∫uA(t)uB(t+τ)dt
In this equation, uA(t) and uB(t) represent the continuous particle velocity recorded at the respective geophones, and $\tau$ represents the time lag. According to seismic interferometry theory, the derivative of this cross correlation function converges toward the actual Green Function of the earth medium between the two sensors, assuming the noise sources are uniformly distributed.
Hardware Requirements for Urban Arrays
Extracting coherent signals from chaotic anthropogenic noise requires highly specialized equipment. Standard exploration geophones often lack the dynamic range and low noise floor necessary for precise interferometric analysis.
Modern nodal geophone systems designed for urban tomography must possess specific characteristics. They require an exceptionally high signal to noise ratio and an internal analog to digital converter capable of resolving microvolt level voltage fluctuations. Furthermore, because the cross correlation process relies entirely on phase alignment, absolute timing precision is critical. Each nodal geophone must be equipped with an internal GPS clock module to ensure millisecond level synchronization across the entire array.
From Cross Correlation to Tomographic Inversion
Once the Empirical Green Function is successfully extracted from the traffic noise, researchers can proceed with standard surface wave analysis. The process involves two major computational phases.
Dispersion Curve Extraction
Surface waves are inherently dispersive, meaning their phase velocity v is a direct function of their angular frequency ω and the horizontal wavenumber k:
v=ω/k
Lower frequency waves penetrate deeper into the bedrock, while higher frequency waves are constrained to the shallow unconsolidated sediments. By transforming the cross correlated waveforms into the frequency domain, geophysicists can pick the fundamental mode dispersion curves for every station pair in the array.
Shear Wave Velocity Inversion
The final step is the tomographic inversion. The measured dispersion curves are inverted to create local one dimensional shear wave velocity profiles. These individual profiles are then spatially interpolated to construct a comprehensive three dimensional volume mapping the local geology, bedrock depth, and hidden fault zones.
Methodology Comparison
To understand why research institutes are rapidly adopting passive techniques for urban site characterization, consider the operational differences detailed below.
| Parameter | Traditional Active Source | Ambient Noise Interferometry |
|---|---|---|
| Primary Energy Source | Controlled explosives or impact weights | Uncontrolled traffic and human activity |
| Typical Frequency Band | Ten to two hundred hertz | One to forty hertz |
| Logistical Footprint | Extremely heavy and disruptive | Completely silent and non invasive |
| Depth of Investigation | Limited by source energy | Highly dependent on array aperture |
From Chaotic Noise to Clear Subsurface Maps
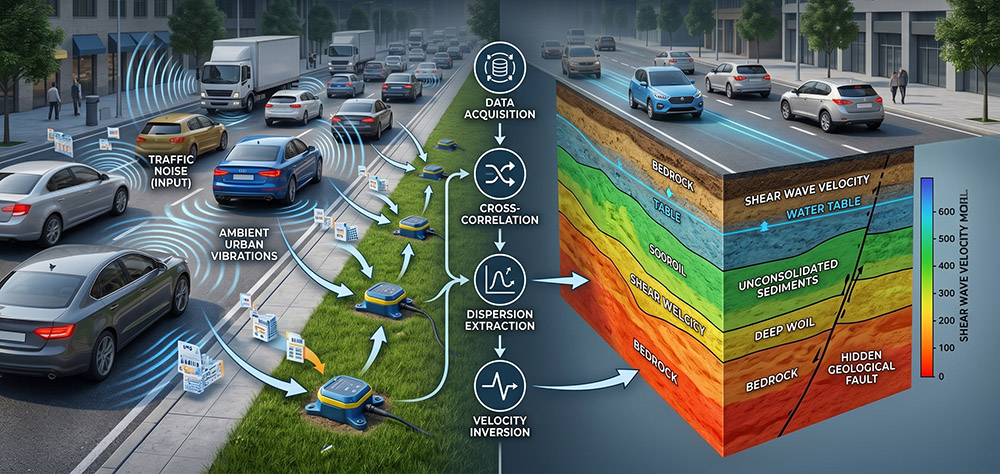
How exactly does a messy recording of a garbage truck turn into a beautiful geological map? The process involves heavy computational power and several critical steps.
Continuous Data Acquisition
The geophone grid records the raw urban background noise for several hours or even days. Academic studies show that the most useful traffic noise typically falls within the frequency range of three to twenty five hertz.
Signal Processing and Noise Removal
Supercomputers filter out temporary anomalies, remove instrumental errors, and prepare the raw continuous data for complex mathematical correlation.
Cross Correlation Analysis
This is the absolute magic of the entire technique. By comparing the exact same traffic noise recorded by two different geophones, the computer can cancel out the random elements. What remains is a virtual seismic wave that looks exactly as if one geophone had fired a small explosion and the other had flawlessly recorded it.
Dispersion Extraction
The software calculates how different frequencies of the reconstructed wave travel at different speeds. Low frequencies travel deep into the heavy bedrock, while high frequencies stay near the loose topsoil.
Velocity Inversion and Tomography
Finally, the system pieces together all the velocity data from hundreds of sensor pairs to generate a comprehensive three dimensional color map showing the exact depth of the local bedrock, groundwater aquifers, and hidden geological fault lines.
Advancing Urban Geophysics
The ability to turn ambient traffic noise into high resolution geological maps represents a monumental leap in near surface geophysics. As sensor technology continues to evolve, the density of these autonomous nodal arrays will increase, allowing for continuous time lapse monitoring of urban groundwater aquifers and seismic hazard zones. For researchers and infrastructure developers looking to implement these advanced surveys, sourcing absolute premium high sensitivity seismic instruments is the most critical step in ensuring data fidelity.
Related Products
- Assorted High Sensitivity Geophones: https://www.seis-tech.com/category/geophones/high-sensitivity-geophones/
Academic References
- Bensen G. and Ritzwoller M. (2007). Processing seismic ambient noise data to obtain reliable broad band surface wave dispersion measurements. Geophysical Journal International, Volume 169, pages 1239 to 1260.
- Campillo M. and Paul A. (2003). Long range correlations in the diffuse seismic coda. Science, Volume 299, pages 547 to 549.
- Nakata N. and Snieder R. (2011). Shear wave imaging from traffic noise using seismic interferometry by cross coherence. Geophysics, Volume 76, pages 97 to 106.
- Shapiro N. and Campillo M. (2004). Emergence of broadband Rayleigh waves from correlations of the ambient seismic noise. Geophysical Research Letters, Volume 31, Issue 7.
- Bao T. and colleagues (2023). Sensing Shallow Structure and Traffic Noise with Fiber Optic Internet Cables in an Urban Area. PMC Geophysics Repository.
- Capotosti A. and colleagues (2026). The assessment of traffic induced vibrations in urban areas by means of cost effective sensors. Bulletin of Geophysics and Oceanography.
- Krawczyk C. and colleagues (2024). Urban subsurface exploration improved by denoising of virtual shot gathers from ambient noise. Geophysical Journal International.
- Zhang Y. and colleagues (2018). Near surface site investigation by seismic interferometry using urban traffic noise in Singapore. Applied Geophysics Research.


